Amplify Insights
Condé Nast
Interface design
2021
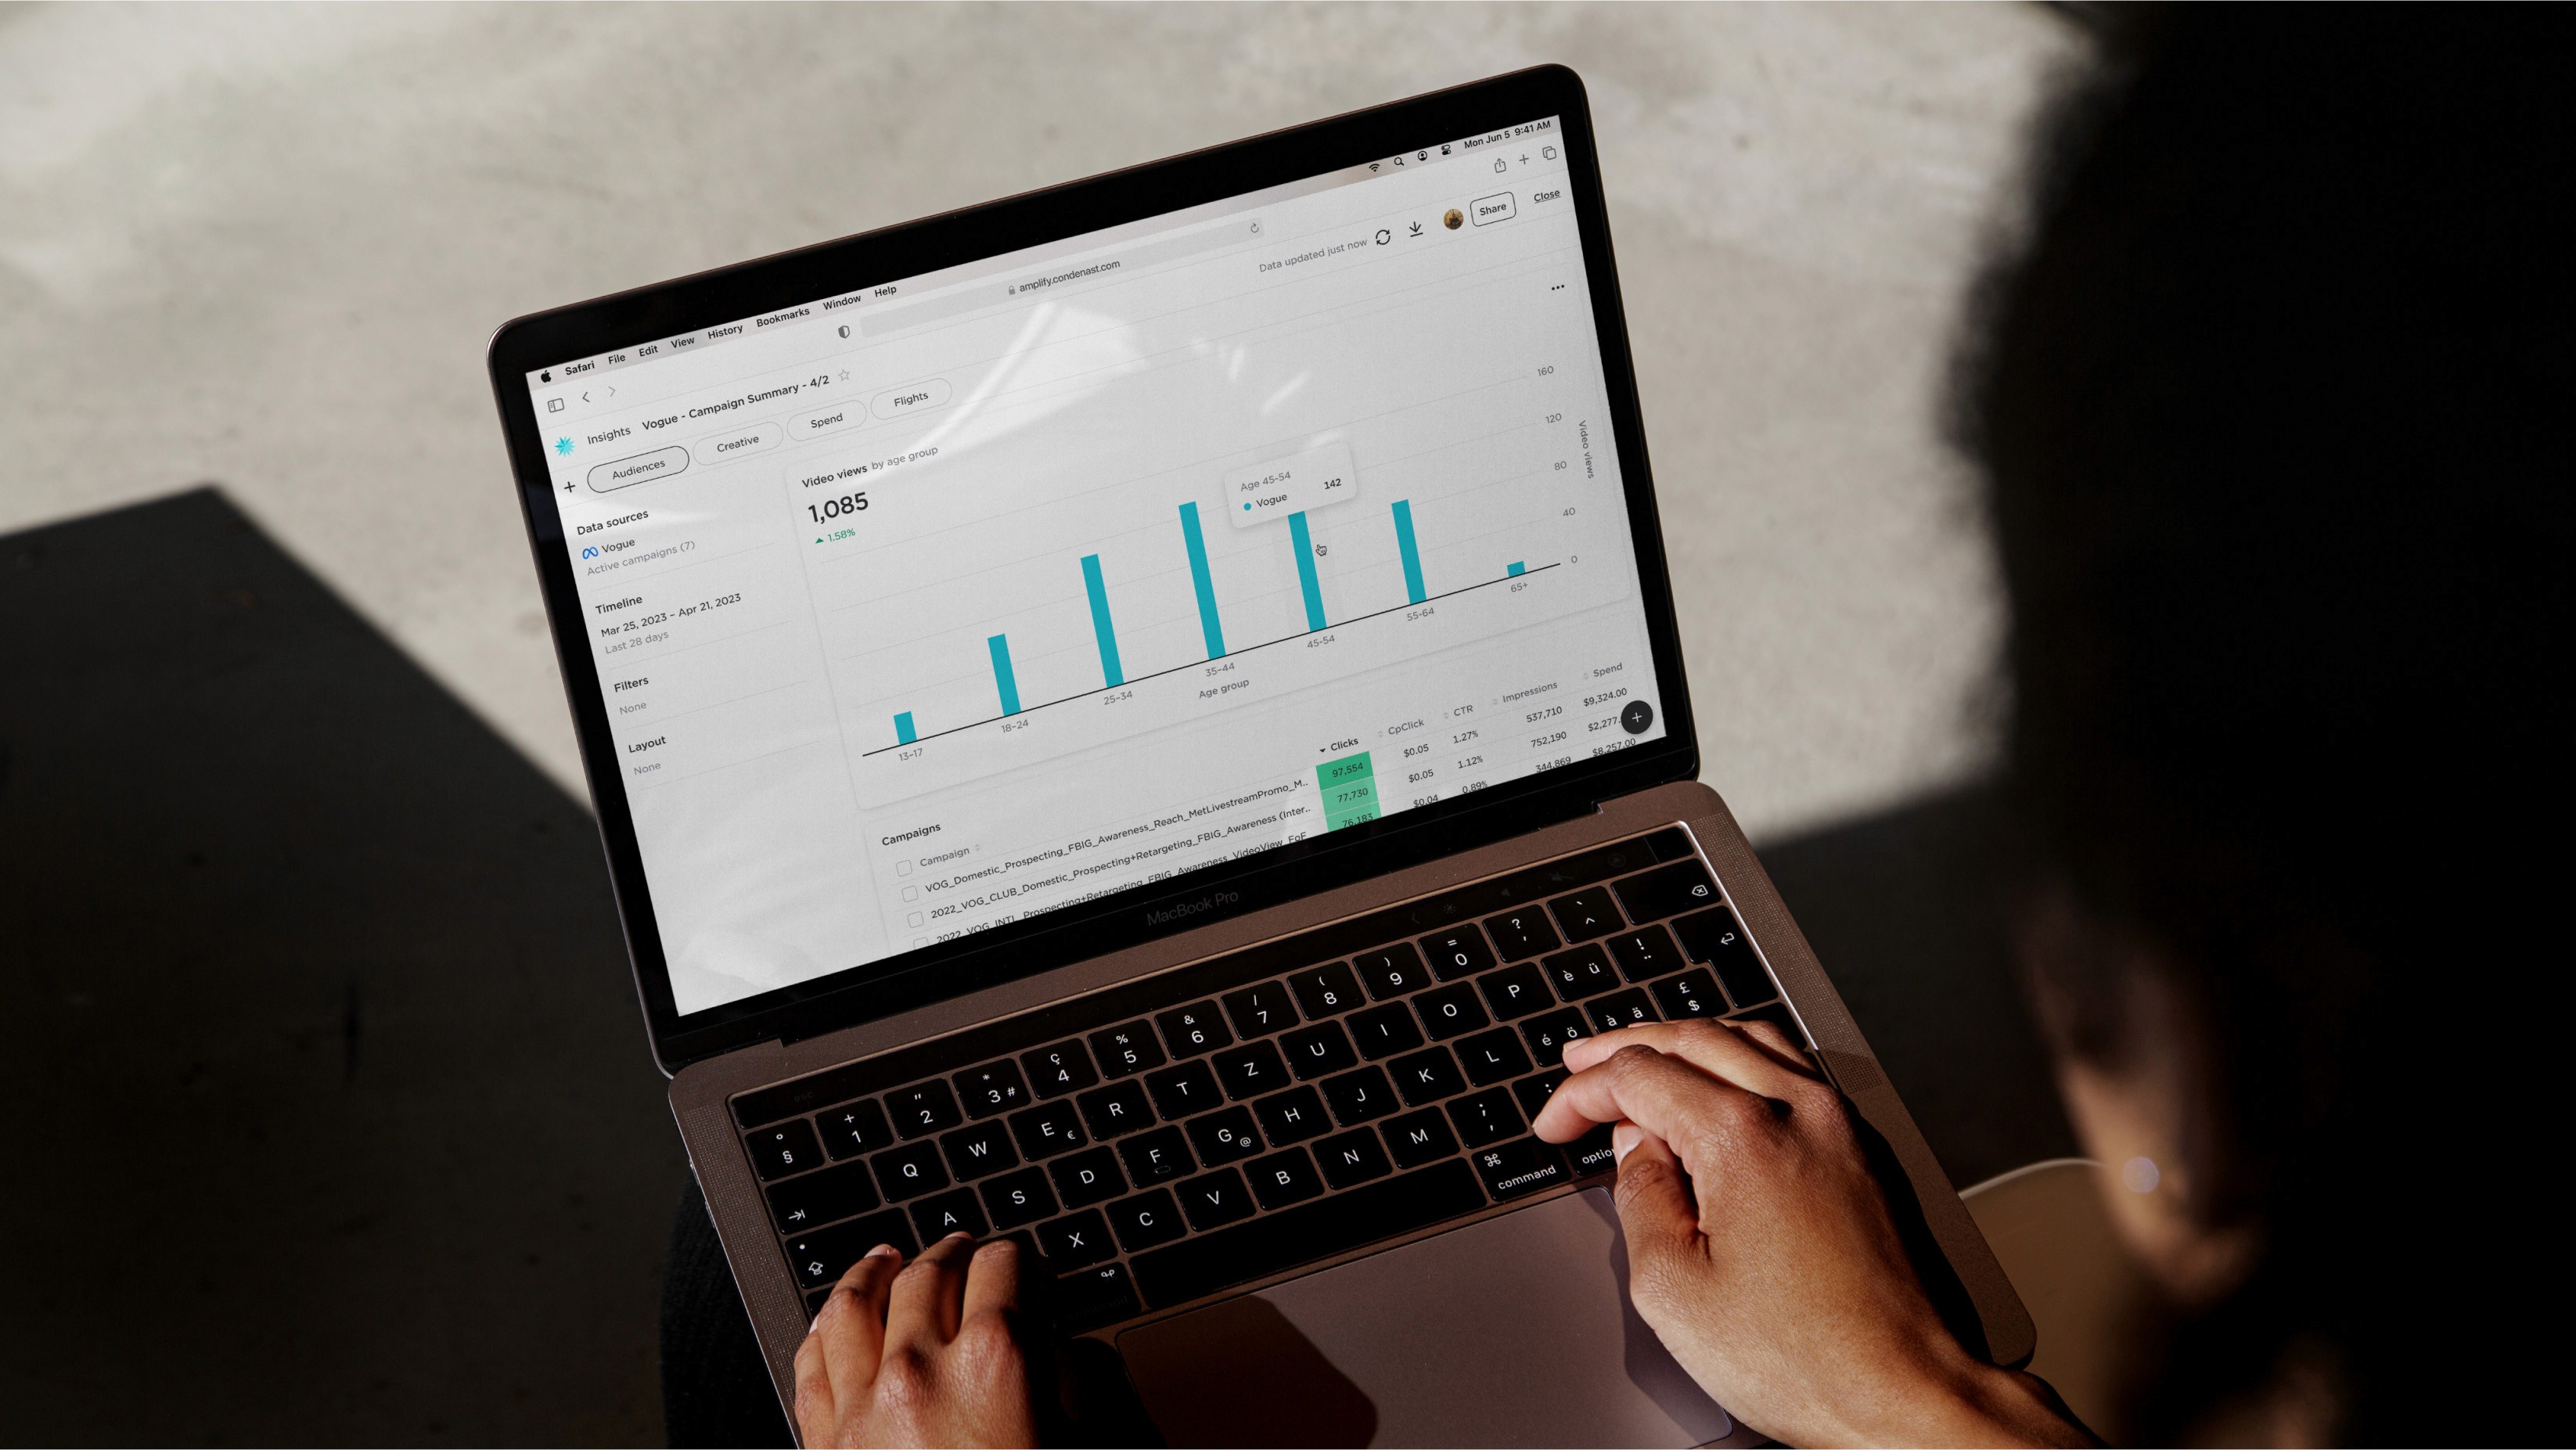
In the vast and often complex landscape of digital advertising, the ability to extract meaningful insights from campaign data is key. Amplify Insights provides a customizable reporting interface, offering campaign managers at Condé Nast a powerful and versatile tool to visualize and understand their campaign performance.

The challenge
The goal with Insights was to create a highly flexible reporting system for campaign managers and analysts that caters to varying reporting goals and can simplify large volumes of ad campaign data into actionable insights. Additionally, the interface should maximize efficiency by reducing repetitive tasks, such as adding familiar metrics and reporting layouts.
Solutions
Surfacing relevant data
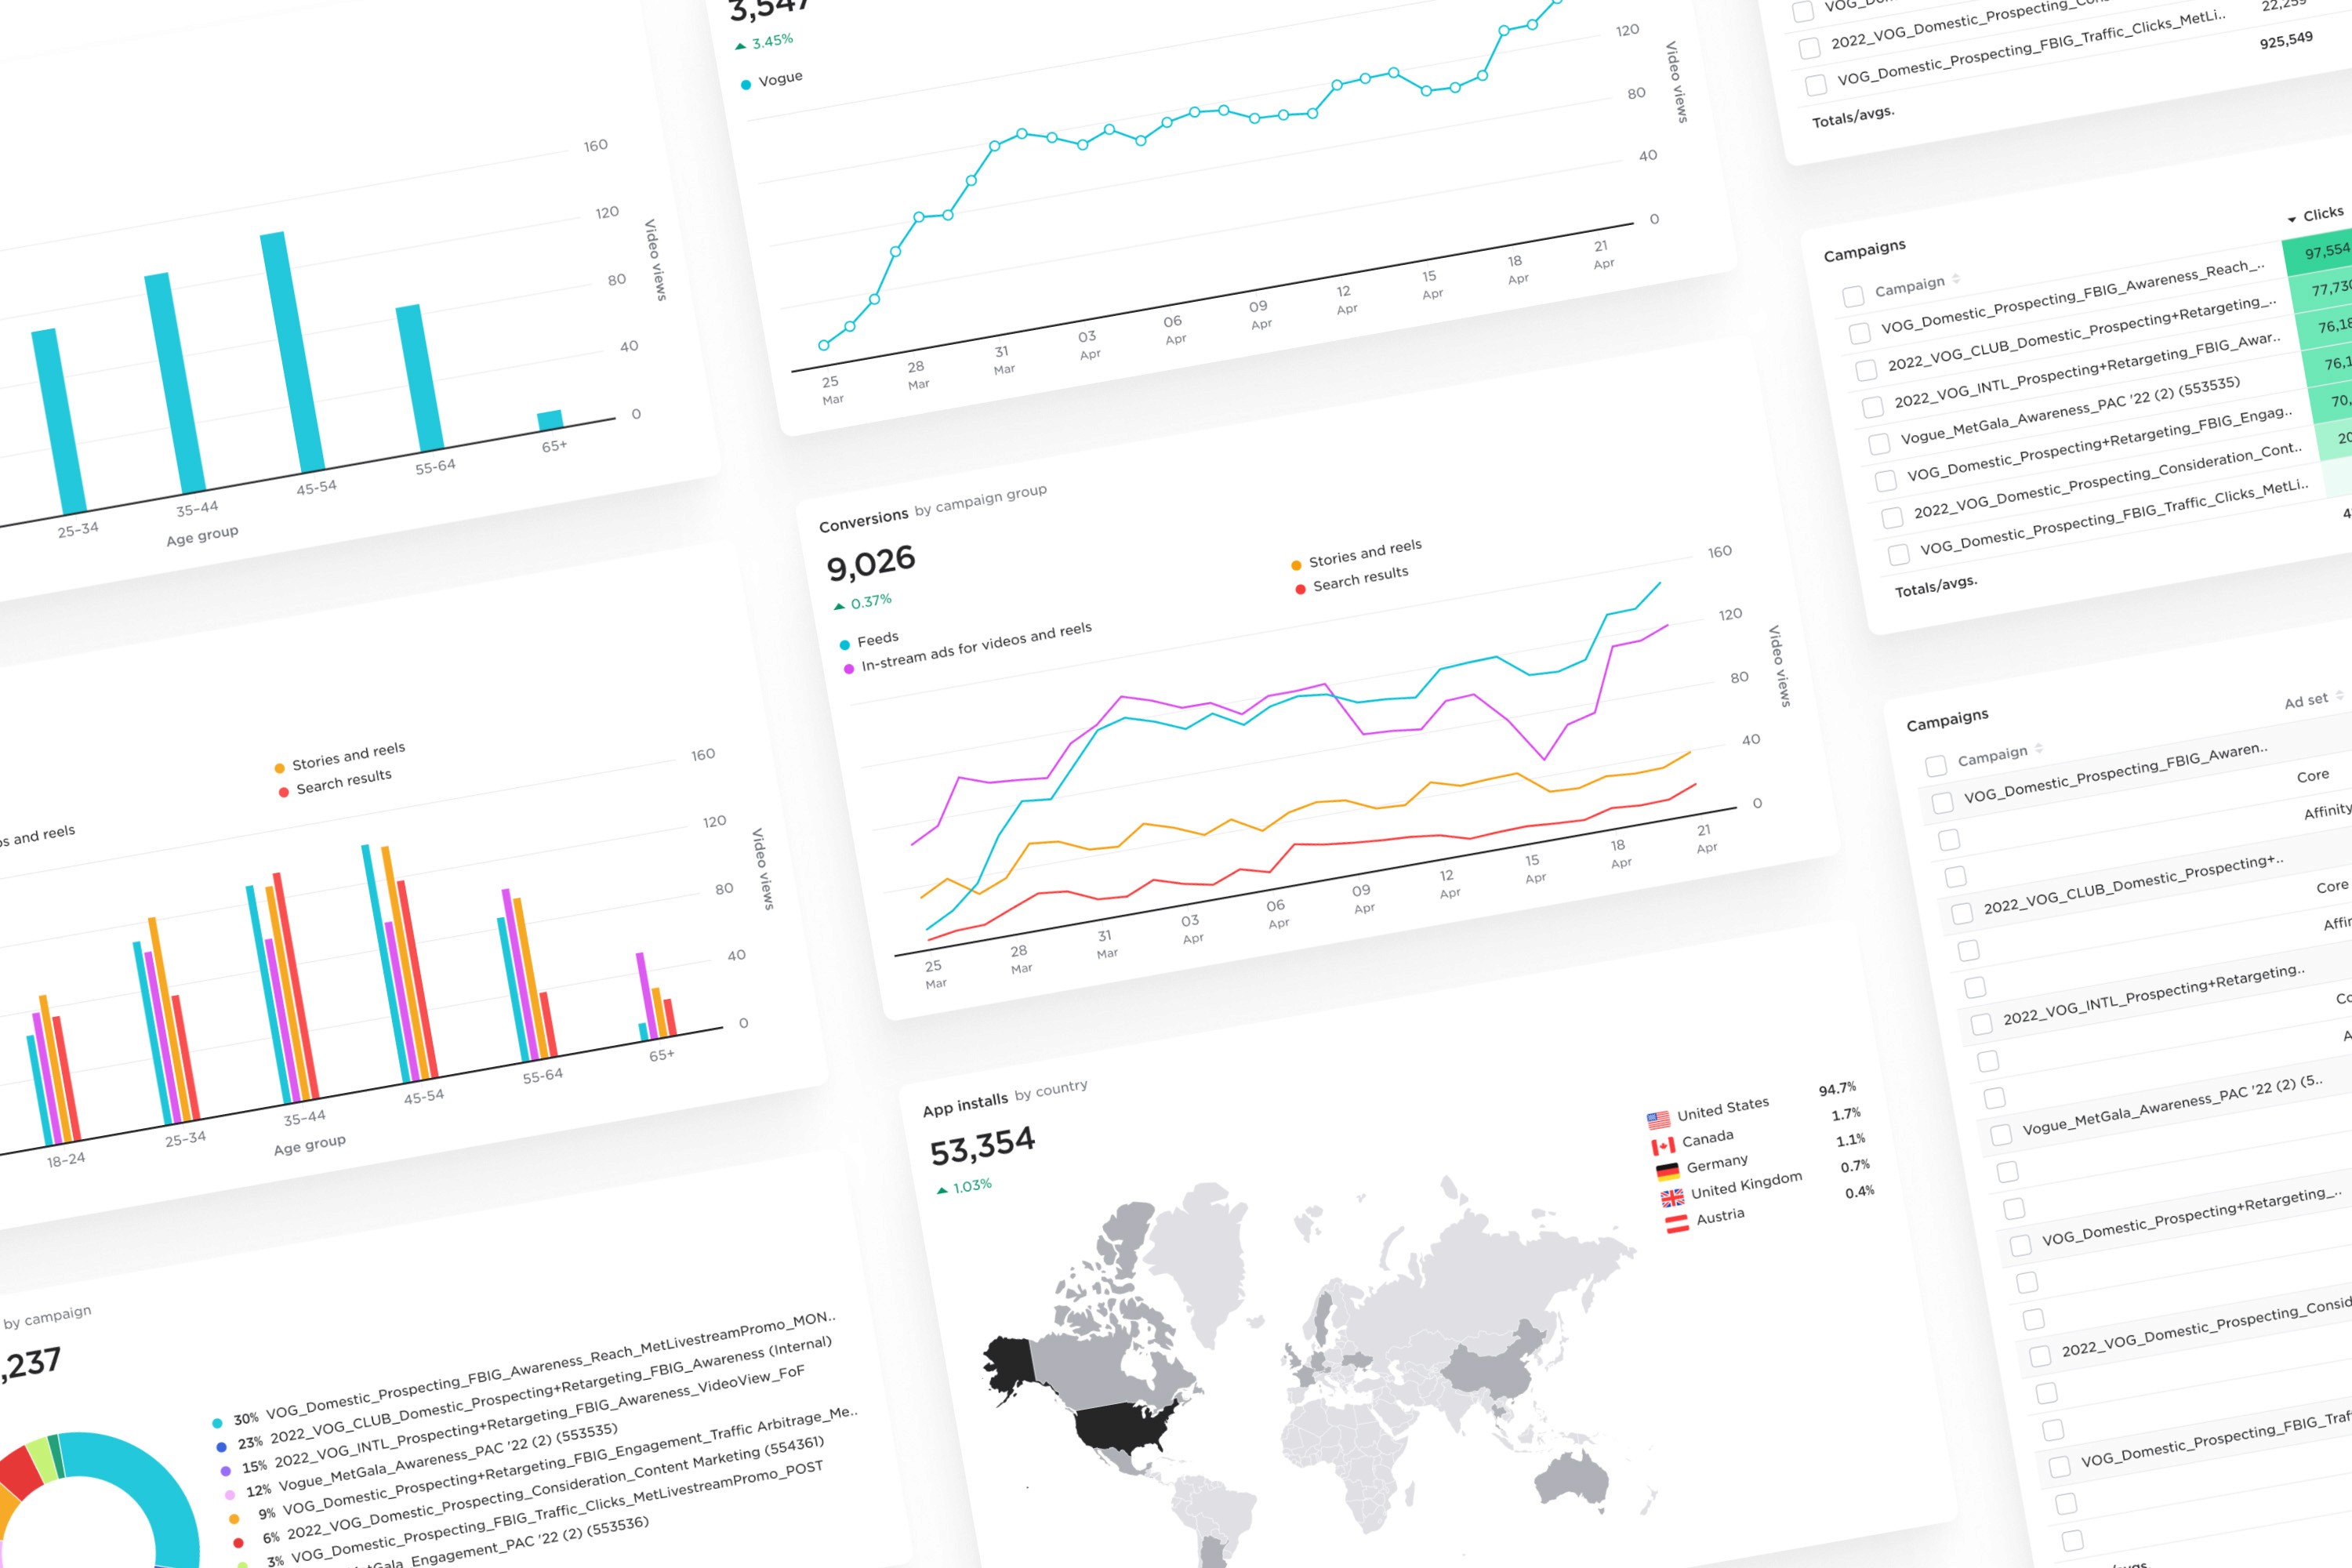
The first step in creating this reporting tool was to research how best to derive insights from ad campaign data. Through a mix of end user interviews and competitive research, a select set of table features and chart types was determined to be adequate for analysis and visualization. Each chart was then designed to be flexible in layout for a drag-and-drop reporting canvas and also to accommodate various formatting options (show legend, totals, breakdowns, etc...).
Any table or chart added to the reporting canvas can be quickly configured to report from a large set of breakdowns and metrics. To further improve efficiency, these breakdowns and metrics were organized into sections and the most commonly used of each were placed in a top section named “popular”. For now, these configurations are done inside a modal window; however, I did plan another iteration of this interface to have chart configurations slide in from the reporting canvas sidebar, in order to stay in place a bit better.
Creating actionable insights
Amplify Insights is the reporting side of the Amplify ads management suite, and both the reporting system and ads management system need to work hand-in-hand. In other words, campaign managers need to be able to gain insight into ad performance and then seamlessly take action when necessary. To achieve this, these two interfaces are bridged by links that take the user from a campaign management asset (campaign, ad, creative etc...) to preset reporting layouts. Then, from the report, actions can be taken to open up campaign editing and make desired changes.
Removing redundancy
Reports are being created constantly to track campaign performance and report back to branded content clients; therefore, it was essential to cut down on repetitive tasks. While reports can always be duplicated and modified, this isn’t always the ideal workflow. As a result of user feedback, I added a way to save and swap report layouts/templates for quick, interchangeable use. Other features such as starring reports, surfacing commonly used metrics, and easily swapping report parameters aided in reducing the time it takes to create a new report.
Making access quick and easy
As mentioned, reports were also frequently shared with external users and within campaign management teams at varying permissions levels. I designed a fast and simple share flow for report creators to invite internal and external users to live reports and manage their permissions. Additionally, report sharers can include a message to invitees to denote the purpose of the report or any further instruction.
Impact
Since its development, Amplify Insights has enabled campaign managers at Condé Nast to analyze and optimize their cross-platform advertising campaigns by providing a unified view of campaign performance. Advertisers can make data-driven decisions more efficiently, resulting in improved ROI and campaign effectiveness. Reports are also key in providing transparency to branded content clients that Condé Nast works with.
52K+
Reports created
